Success in a software-as-a-service (SaaS) business model requires careful and well-informed decision-making. Tracking key performance indicators is one way to maintain momentum.
While revenue is a vital metric, Best SaaS Metrics is not the only indicator of a SaaS company’s performance. SaaS businesses rely heavily on customer relationships. As a result, they have to continuously analyze and monitor a variety of customer experience variables.
This abundance of data can be overwhelming, but don’t worry. In this guide, we’ll explore the key SaaS metrics for monitoring your business’s performance.
Understanding SaaS Metrics
SaaS metrics are data points companies use as a benchmark to monitor their performance. Through these metrics, software-as-a-service companies can set performance goals and plan for the future.
Unlike traditional business metrics that focus on one-time sales, immediate profits, and efficiency, SaaS metrics emphasize long-term customer relationships and income streams. Thus, they focus more on customer lifecycle and retention, as well as recurring revenue.
Retention Rate
Retention rate is the rate at which your business keeps customers for a specific amount of time.
Customer retention is especially important in the SaaS business model, as customers who continually deal with the business can increase their profits on a long-term basis. According to Gartner, 80% of a company’s future income will rely on just 20% of its current customers.
Customer Churn Rate
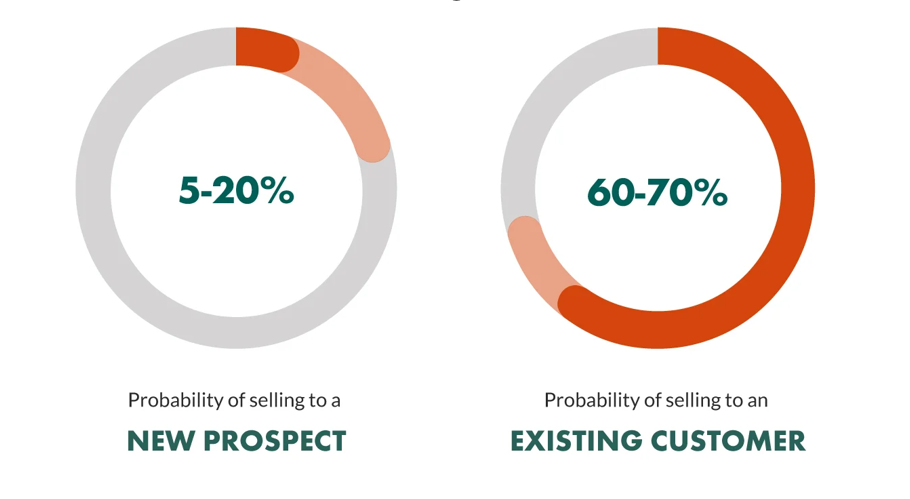
Customer churn rate is the percentage of clients or accounts that discontinue their subscriptions (churned) in a specified amount of time. It’s crucial to keep current users to maintain your profitability. Marketing Metrics says you are 60-70% more likely to sell to an existing customer and only 5-20% likely to sell to a new one.
-
Strategies to Reduce Churn
Reducing churn rates involves active customer engagement and knowing their pain points:
- Ask departing customers why they left to identify and address root issues.
- Offer educational resources to help customers use your product effectively.
- Ensure exceptional service to prevent churn due to poor experiences.
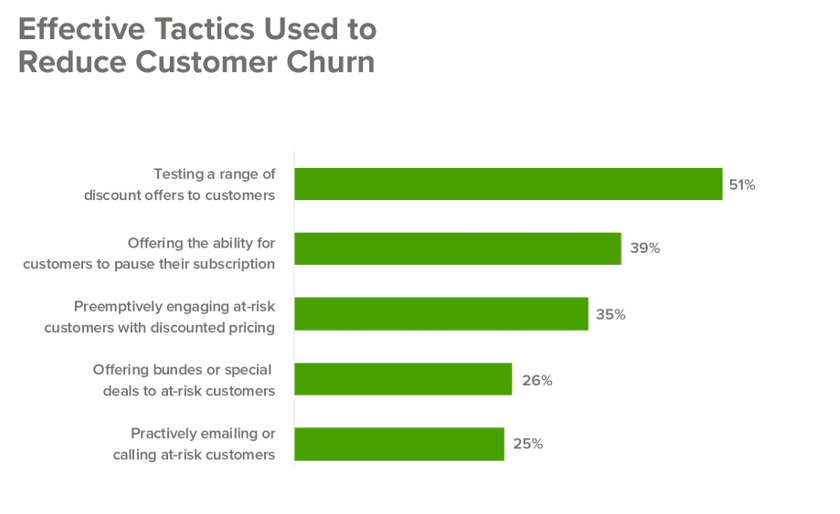
- Use targeted discounts and special offers to retain at-risk customers.
Applying these strategies can help increase customer satisfaction and, consequently, their lifetime value.
Customer Lifetime Value (CLV or LTV)
Customer lifetime value measures the total amount of money your company receives or expects to receive from a customer during their entire relationship with your business. The calculation of CLV involves multiple steps but can be simply represented by the following formula:
A stable business is built on customer lifetime value (CLV). A low CLV shows room for improvement in meeting client expectations or spending on client acquisition. A high CLV, on the other hand, equals happy and loyal customers. This gives you leverage to reinvest your profits in new growth strategies.
Customer Acquisition Cost (CAC)
Customer acquisition measures how much you spend on acquiring new customers. It factors in the total cost of marketing and sales efforts needed to convince prospects to avail of your services or purchase your products.
Balancing CAC with Customer Lifetime Value (CLV) ensures that the revenue generated from a customer over their lifetime exceeds the cost to acquire them. This prevents funds from going to waste due to ineffective sales and marketing initiatives.
Monthly Recurring Revenue (MRR) and Annual Recurring Revenue (ARR)
Monthly Recurring Revenue (MRR) is a metric of the average revenue a business expects to receive from customers in a single month.
Annual Recurring Revenue (ARR), on the other hand, is the projected revenue a business generates in one full year.
Consistent income streams reduce the reliance on one-time sales and provide financial predictability, allowing you to plan and invest confidently. Since revenue is heavily reliant on the customer lifecycle, both of these metrics are directly impacted by the activation rate.
Activation Rate
This is also referred to as “sign-up to paid conversion rates.” It represents the proportion of your newly acquired customers who complete a milestone in your onboarding process. Milestones include completing registrations, starting a paid subscription, or making a purchase.
Divide the number of users who signed up by the number who reached the activation point or milestone, then multiply by 100.
The activation rate is a strong indicator of initial user engagement, which itself is a predictor of user retention. And the more customers you retain, the more revenue you generate. Ben Winter from Fairmarkit says a 25% increase in activation leads to a 34% MRR growth in 12 months.
Once you notice a low activation rate, you can investigate at what point your onboarding process drops off or struggles.
-
Strategies to Improve Activation Rates
- Use interactive tutorials during onboarding to guide users through key features.
- Simplify account setup by using single sign-on (SSO) options or by asking for minimal information.
- Personalize the onboarding process based on a user persona’s pain points.
- Use gamification elements like rewards or badges to motivate users to finish onboarding.
- Provide continuous support through an in-app resource center.
- Collect user feedback to identify problem areas.
Average Revenue per Account (ARPA)
ARPA is a revenue metric that measures the average monthly or annual revenue generated from existing accounts. The key distinction between ARPA and ARPA is in the words user and accounts. Accounts can include organizations with multiple users. Calculating ARPA involves dividing your MRR or ARR by your total number of accounts, not including free trial accounts.
-
Strategies to Increase ARPA
- Use tiered pricing models or scalable pricing based on usage.
- Get long-term customers to upgrade or subscribe to higher tiers or additional services.
- Target high-value prospects who are more likely to generate larger revenue.
- Offer packages of related features and services at a higher price point.
Net Promoter Score (NPS)
The net promoter score measures customer satisfaction and loyalty by measuring how willing a customer is to recommend the business to others through a single question: “On a scale from 0 to 10, how likely are you to recommend our product/service?”
Customers are subsequently grouped based on their responses:
- Promoters (9-10) or recurring customers who readily spread positive word-of-mouth.
- Passives (7-8) or happy customers who are hesitant to recommend the service and are vulnerable to being poached by competitors.
- Detractors (0-6) or unhappy customers who can damage your brand’s reputation through negative reviews.
NPS is calculated by subtracting the percentage of detractors from the promoters.
There is usually an open feedback section at the end of every survey, so companies use it as a chance to improve. In an interview, Karin Blomqvist, Director of Product Management at Zensai, detailed their feedback process using the net promoter score.
Surveys showed the user interface needed improvement. As a result, they planned to update the interface’s look and improve the UX design so users could perform tasks faster.
Net Revenue Retention
Net revenue retention (NRR) measures how much revenue a company keeps from existing customers over time. NRR provides a more comprehensive view of revenue retention as it accounts for upgrades, downgrades, and churn.
Essentially, it tells you how effective your customer retention strategies are and how well you increase revenue from retained customers through expansions.
Calculating the NRR will require the MRR.
-
How to Maximize Net Revenue Retention
- Give discounts to customers who sign up for an annual subscription.
- Offer a free month to customers who successfully make referrals.
- Offer new features or content exclusive to paying customers.
Expansion Revenue
Revenue expansion refers to the additional income from existing users and excluding new ones. This can come from upsells and cross-sells, as well as add-on subscriptions. These are what “expansions” in the previous equation were referring to.
In calculating the expansion revenue, you need to subtract revenue from new customers and regular subscriptions from your MRR. Another way is to simply add your monthly revenue from upsells and cross-sells.
Expansions help sustain a SaaS business by providing a steady flow of income as it tries to increase its consumer base. Focusing on up-sells and cross-sells to existing customers can yield immediate results while avoiding added expenses. Offering complementary products and services are just some of the ways to increase expansion revenue.
Number of Active Users
The number of active users (NAU) is a key SaaS metrics that measures the total number of users actively engaging with a product or service. It tracks how often customers use the product. Getting the NAU simply involves adding up all the users who used the product in a certain period.
The NAU highlights key engagement areas by periodically tracking the frequency of user interaction and feature use. This allows for timely adjustments in case friction points are identified. It also measures the performance of newly implemented features.
-
Tips to Increase User Activity
- Make the interface user-friendly, intuitive, and bug-free.
- Regularly update the interface and features based on user feedback.
- Release personalized content, recommendations, and experiences.
- Run targeted campaigns such as email reminders, push notifications, or in-app messages.
- Implement gamification such as leaderboards and score points.
- Create in-app community forums where users can interact, share experiences, and provide support to each other.
Customer Health Score
The customer health score (CHS) assesses how likely a customer is to churn or drop a subscription or product. SaaS Metrics is also useful in identifying which customers are optimal candidates for upselling. Once you track the CHS, you can identify areas of concern that increase the risk of churning.
The customer health score does not have a fixed formula. Instead, it involves blending multiple indicators that reflect a customer’s health and engagement level with your product or service. A common method includes the following steps:
- Start by identifying key metrics such as:
- Product usage frequency
- Customer satisfaction (through surveys like NPS)
- Support ticket volume and resolution time
- Assign weighted scores to each metric based on their importance to your business.
- Tally up the scores, typically on a scale from 0 to 100, where higher scores indicate healthier, more engaged customers.
Traffic-to-Lead Rate
The traffic-to-lead rate measures the percentage of website visitors who become leads. Leads are visitors who show interest in your product, either by providing contact information or clicking a certain call to action. It is calculated by dividing the number of leads by the number of website visitors and then multiplying by 100.
High website traffic doesn’t equal increased revenue. Instead, it’s the ability to capture and nurture leads that translate into sales and revenue. This maximizes the ROI of your marketing strategies and improves customer acquisition.
Use compelling CTAS, well-designed and mobile-friendly websites, and trust signals to help increase conversion rates.
Lead-to-Customer Rate
If the previous metric measures visitor-to-lead conversion, this metric measures lead-to-customer conversion. It’s the percentage of the newly acquired leads that convert into paying customers.
It’s a critical metric in the sales funnel as it depicts the efficiency of your sales process and lead quality. A high rate means your team is proficient at converting leads. You can improve this rate through quick, personalized responses, follow-ups, or training your sales team.
Bonus Metric 1: Customer Engagement Score
The Customer Engagement Score (CES) quantifies how actively and effectively customers are using your product or service. Unlike the customer health score, which focuses on customer relationships, the CES is only focused on product activity.
It is calculated similar to the CHS but focuses solely on engagement indicators such as:
- Frequency of use
- Session duration
- Renewal rates
This can be improved through more personalized onboarding, interactive tutorials, and regular feature updates.
Bonus Metric 2: Viral Coefficient
The Viral Coefficient is the rate at which existing users refer new users to a product. It reflects a product’s potential for organic growth. This metric is calculated by multiplying the number of invites sent per user by the conversion rate of those invites.
You can increase the viral coefficient by offering incentives for both referrers and referees, using social media sharing features, and ensuring a compelling user experience that motivates users to share the product with their network.
Final Thoughts
The health of a SaaS company relies on multiple factors: customer acquisition, retention, and engagement. Therefore, it’s important to monitor metrics that assess revenue and illustrate its relationship with the aforementioned SaaS health indicators.
Now that you understand how to calculate these metrics, dedicate some time to thoroughly analyzing these metrics so you can have a clearer view of your business perform by lifetime. The true value comes from using these insights to inform and shape your business strategies.
FAQs
Q. How do SaaS companies track and measure customer satisfaction beyond these metrics?
A. They often use tools like surveys, user interviews, and sentiment analysis from social media and customer support interactions. These methods provide deeper insights into customer experiences and pain points.
Q. How do SaaS companies balance Customer Acquisition Cost (CAC) and Customer Lifetime Value (CLV)?
A. Some ways they can balance the two are by focusing on acquiring high-quality leads, improving customer retention strategies, or enhancing the onboarding process to increase CLV. They can adjust their marketing and sales plans to reduce CAC.
Q. How can tracking the Average Revenue per Account (ARPA) help adjust pricing?
A. ARPA can inform pricing strategies by identifying opportunities to adjust pricing tires, introduce new features, or create value-added packages. These can increase revenue without increasing costs.


