

A company’s financial figures can either attract investors or drive them away. This is the importance of accurate financial ratio analysis, which is true for tech companies.
In contrast to most businesses, tech firms often only have intangible assets. Their inventories are practically non-existent, as they typically rely on software or intellectual property. Further compounding the issue are the large sums of debt they incur. As a result, financial officers and investors use financial ratios to avoid financial risks.
In this article, we’ll discuss the different types of financial ratios, how to calculate them, and how the technology industry can benefit from them.
- Introduction to Financial Ratios
- Importance of Financial Ratios in the Tech Industry
- Essential Financial Ratios for Technology Companies
- Leveraging Financial Ratios for Strategic Planning
- Challenges in Interpreting Financial Ratios
- Advanced Techniques in Financial Analysis
- Tools and Resources for Financial Ratio Analysis
- Understanding Cash Flow Ratios
- SaaS Metrics for Financial Evaluation
- FAQs About Financial Ratios
What Are Financial Ratios?
Certain figures in financial books reveal a company’s potential and viability: assets, liabilities, revenues, and expenses. Financial ratios are numerical expressions showing how these different figures relate to one another.
They give you multiple perspectives on a company’s financial health. This includes:
- A company’s ability to settle its debts (liquidity ratios).
- How well the business is generating revenue (profitability ratios).
- How effectively resources are being used (efficiency ratios).
- Its ability to meet long-term financial obligations (solvency ratios).
- How investment-worthy they are (market value ratios).
Importance of Financial Ratios in the Tech Industry
Financial ratios can help define pivotal business decisions, including whether to invest in new technology or expand into new markets. Both decisions carry significant costs and risks. Ratios assess the potential profitability and efficiency of these investments, which can help you determine the best course of action to maximize profit. Since they indirectly assess areas like operations and management, among others, they also assess a company’s overall performance.
Comparing your present ratios with past data can help identify progress or regression in performance. Meanwhile, comparing your ratios with the rest of the industry can help identify strengths and weaknesses in your financial and operational processes. This allows you to make adjustments or adopt strategies used by your competitors.

Key Financial Ratios for the Tech Industry
The tech industry relies on several critical financial ratios for analysis and decision-making. Here are some of the most important ones:
1. Liquidity Ratios
These assess a company’s ability to convert assets into cash to pay short-term debts. They are crucial since many tech companies struggle to generate revenue and may need to liquidate assets to cover due debts.
- Current Ratio
This ratio, also known as the working capital ratio, measures a company’s ability to pay off current liabilities, taking into account all of its assets. This ratio is crucial for tech firms since they need to have enough liquid assets to pay off investors and sustain their progress.
The formula for the current ratio is: 
Where Current assets include:
- Cash or cheques
- Marketable securities or short-term investments
- Inventory
- Receivables
- Prepaid expenses, like software subscriptions
Current liabilities include:
- Short-term debts
- Payables
- Accrued expenses
The average current ratio for tech companies usually falls between 1.5 and 3, although this can vary by sector. This range ensures enough liquidity to cover current debts. A ratio below one, however, can raise concerns about your ability to pay your dues.
- Quick Ratio
The quick ratio, or acid-test ratio, measures a company’s capability to pay off due debts using only assets that can be converted to cash within a year or less. In short, it removes inventory and prepaid expenses from the equation. This is beneficial for tech startups with limited cash and no inventory.

- Cash Ratio
The cash ratio shows a company’s ability to pay short-term debts using only its most liquid assets–cash and short-term investments. This ratio is critical for tech firms with inconsistent cash flows since it gives the most precise picture of liquidity. A strong cash ratio means you can sustain your operation even in the face of unexpected expenses or seasonal fluctuations.

2. Profitability Ratios
These ratios help us understand how well companies make money from sales. Examining these ratios can help reveal a company’s potential for long-term growth and market share despite current financial losses.
- Gross Profit Margin
This ratio measures the total amount of money you earn from sales before deductions. It shows how well a company manages its production costs, such as raw materials and labor, to produce its goods.

- Net Profit Margin
Net profit margin shows how much profit a company makes from its revenue. It encompasses all business aspects–production, administration, and financing–making it a key indicator of overall profitability.

Where:
Net Profits = Total Revenue – Total Expenses
- Total Revenue is the amount of money you earn from sales or services before any expenses.
- Total Expenses are the sum of all production costs, including:
- Costs of goods sold (COGS)
- Operating expenses
- Interest expenses
- Taxes
Let’s apply this formula to one of the world’s largest tech companies–Apple. Here is a portion of for the quarter ending March 30, 2024:
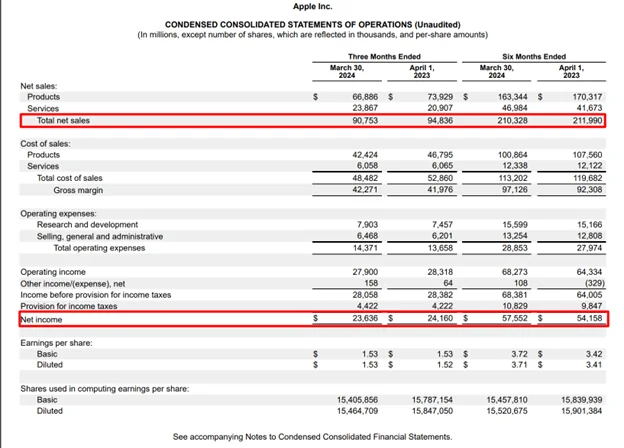
- Net sales or revenue: $90.8 billion
- Net income: $23.6 billion
Using the equation ($23.6 billion ÷ $90.8 billion) × 100, we get 26.0%. This means the company kept $0.26 for every dollar generated in sales.
- Return on Assets (ROA)
Return on Assets (ROA) measures your company’s profitability relative to its total assets. It shows how effectively you use your assets to generate profits. A higher ROA indicates that you use fewer assets and incur lower costs to generate income.

3. Efficiency Ratios
These financial ratios help you see the potential profit or return on investment from the money you spend on operations.
- Inventory Turnover
Inventory turnover measures how many times your company’s inventory is sold and replaced over a period, typically a year. This is critical for tech companies whose products often have short life cycles, and unsold inventory can be extremely costly.

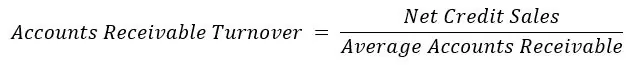
- Accounts Receivable Turnover
Accounts receivable turnover measures how often a company collects its accounts receivable and how efficiently its credit policies and collection processes work. This allows you to adjust your receivables management so you can maintain a consistent cash flow and reduce bad debt.
4. Solvency Ratios
These are also called financial leverage ratios. They measure a company’s ability to manage its long-term debts, unlike liquidity ratios, which focus more on the short term.
- Debt-to-Equity Ratio
The D/E ratio compares a company’s total debt to its shareholders’ equity. It reveals the extent to which the company leverages debt to finance its operations and acquire assets rather than using its own funds.

- Interest Coverage Ratio
The interest coverage ratio shows us how well a company can cover its interest payments with its earnings. A higher ratio signifies greater earnings compared to interest expenses, lowering the risk of defaulting.

5. Market Value Ratios
These measure and analyze your stock value and compare it with that of your competitors. They determine whether a company is truly worth the investment and is not underpriced due to hidden issues.
- Price-to-Earnings Ratio (P/E)
This can determine whether a technological firm is overvalued or undervalued by comparing its current share price to its earnings per share (EPS).

EPS is usually found in earnings releases or by trailing a company’s performance in a year.
- Dividend Yield
The dividend yield, on the other hand, can help investors determine the returns they can expect from dividends alone. A consistent or rising dividend yield suggests a tech company has enough profit to reward its shareholders. Investors should still exercise caution, however, as it might also be due to a declining stock price.

Where annual dividends per share are the total dividends divided by the shares outstanding. You can use the dividends from the last full year’s financial report or the last four quarters.
Using Financial Ratios for Strategic Planning
Integrating financial ratios can help you identify strengths, weaknesses, opportunities, and threats (SWOT analysis).
Here’s how to include them in your planning:
- Set specific, measurable, achievable, relevant, and time-bound goals. For example, to improve operational efficiency by 8% within the next 12 months.
- Select the financial ratios that align best with your goals. In the above example, you can use the gross profit margin.
- Benchmark your ratios with those of your industry peers.
- Develop realistic action plans that consider other business aspects and unforeseen circumstances. These plans can include price adjustments, cost reductions, or debt restructuring.
- Monitor and analyze critical ratios to detect early signs of financial distress or growth opportunities.
- Review plans and financial ratios regularly to ensure that they remain relevant and aligned with the company’s long-term vision.
Common Challenges in Interpreting Financial Ratios
Although financial ratios are powerful tools, they have their limitations. Failing to consider these limitations can harm your business instead of benefiting it.
A common pitfall in financial ratio analysis is the likelihood of misinterpretation. Never assume a single ratio paints a complete financial picture. Instead, you should analyze them in conjunction with other metrics and within the broader context of the business. Failing to account for seasonal fluctuations and significant economic downturns can also skew results.
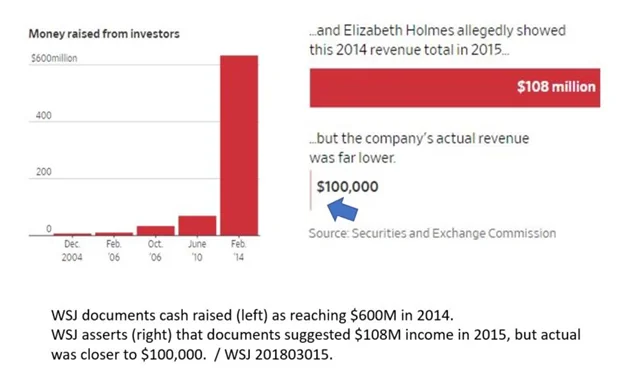
Additionally, some companies manipulate their records to gain the upper hand. Theranos is a perfect example. They falsely claimed expected revenues of over $100 million. Investors relied on these figures, which potentially skewed their financial ratios, eventually causing severe losses.
Financial, operational, and management processes also vary between industries due to industry-specific standards and regulations. This makes cross-industry comparisons complicated and prone to inaccurate interpretations.
Advanced Analysis Techniques
There are numerous ways to analyze financial ratios. Two of the more advanced techniques include:
-
Trend Analysis
This method, also known as horizontal analysis, tracks changes in ratios over a given period. By calculating yearly or quarterly changes, you can identify areas where you’ve improved or deteriorated over time.
-
Comparative Analysis
Comparative analysis can help you understand how your company’s performance compares with that of your competitors. Here’s a scenario: Your gross profit margin is 8%. In your opinion, that’s too low. But when you compare it to your competitors’ 5%, you’re actually in great shape. If, however, their profit margins are above yours, then you’re in trouble.
Emerging Trends and Future Outlook
Two emerging technologies are making a great impact on the finances of businesses worldwide: AI and Machine Learning. By analyzing more extensive data sets, these two can improve the accuracy and predictive power of financial ratios.
They can even help increase revenue. In one survey, companies using these emerging technologies had 58% faster revenue growth compared to non-users and 80% faster profitability growth.
Financial ratios are now also used for predictive analytics. They can identify patterns in a company’s financial performance, helping forecast future profitability, liquidity, and financial stability.
Resources and Tools for Financial Ratio Analysis
If you want to learn more about financial ratio analysis, the internet has a wealth of resources. If you’re a beginner and want more comprehensive information, look to online course platforms:
- Coursera
- edX
- Udemy
If you simply need a refresher or need information quickly, visit websites like Investopedia or The Balance. These websites offer tutorials for various financial concepts.
1. Software and Applications
If you’re looking for tools to streamline your financial analysis, here are some popular options:
- Financial Spreadsheets, like Microsoft Excel or Google Sheets, are essential for basic calculations and data manipulation.
- Financial Modeling Software, such as FinModelsLab or eFinancialModels, can automate ratio calculations and allow you to create various financial models.
- Business Intelligence Software, like Tableau and Power BI, allows you to connect to multiple sources of real-time data and analyze them from a single dashboard.
- Financial Analysis Software, such as Finviz or Bloomberg Terminal, provides up-to-date information on different markets, industries, and companies.
Explained Cash Flow Ratios
Cash flow ratios measure a company’s capability of paying off due debts using only cash earned within a certain period.
1. Operating Cash Flow Ratio
The operating cash flow ratio measures a company’s ability to cover its short-term liabilities using only cash generated from operations. It is calculated as:

Since it only focuses on operating cash flow, it’s a more accurate measure of a company’s liquidity. A high ratio means your business operations are bringing in enough cash to cover your liabilities.
SaaS-Specific Metrics for Financial Analysis
Owing to the unique nature of their business model, SaaS companies rely on industry-specific metrics that track and analyze the number of users they enroll and keep.
1. Monthly Recurring Revenue (MRR)
The MRR measures the total recurring revenue a SaaS company generates on a monthly basis. This metric can forecast future revenue and assess how effective your customer acquisition and retention strategies are. The formula for Monthly Recurring Revenue is:
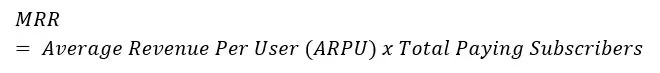
Where:

Final Thoughts
Financial ratios are a necessity for technology industry decision-makers. Their continuous drive to push their companies forward requires a clear understanding of their company’s financial health. Integrating financial ratio analysis into regular business planning enables business leaders to evaluate their own performance and strategize for the future.
The power of financial ratios will only grow. As AI, Machine Learning, and Cloud Systems continue to advance, new methods of analysis will also emerge. These new tools will give us more accurate forecasts. With the added accuracy, we can confidently navigate financial uncertainties and capitalize on new opportunities.
Frequently Asked Questions about Financial Ratios
Q. What other financial tools can I use with financial ratios?
A. You can use other financial techniques and tools like cash flow analysis, profitability analysis, and valuation models. Combining these methods with financial ratio analysis can give you a more holistic view of your financial performance and potential.
Q. What is the average current ratio for the technology industry?
A. The average current ratio for the technology industry varies. Recent estimates suggest that the average current ratio for the technology industry and its various sectors ranges from 1.5 to 3.
Q. What is the most important liquidity ratio for technology companies?
A. All liquidity ratios mentioned are important for technology firms. The cash ratio is often considered the strictest and, therefore, the most impactful. Since they typically have low inventory levels, the cash ratio is a more accurate test of their ability to pay short-term debts. This applies to both big tech companies and startups.